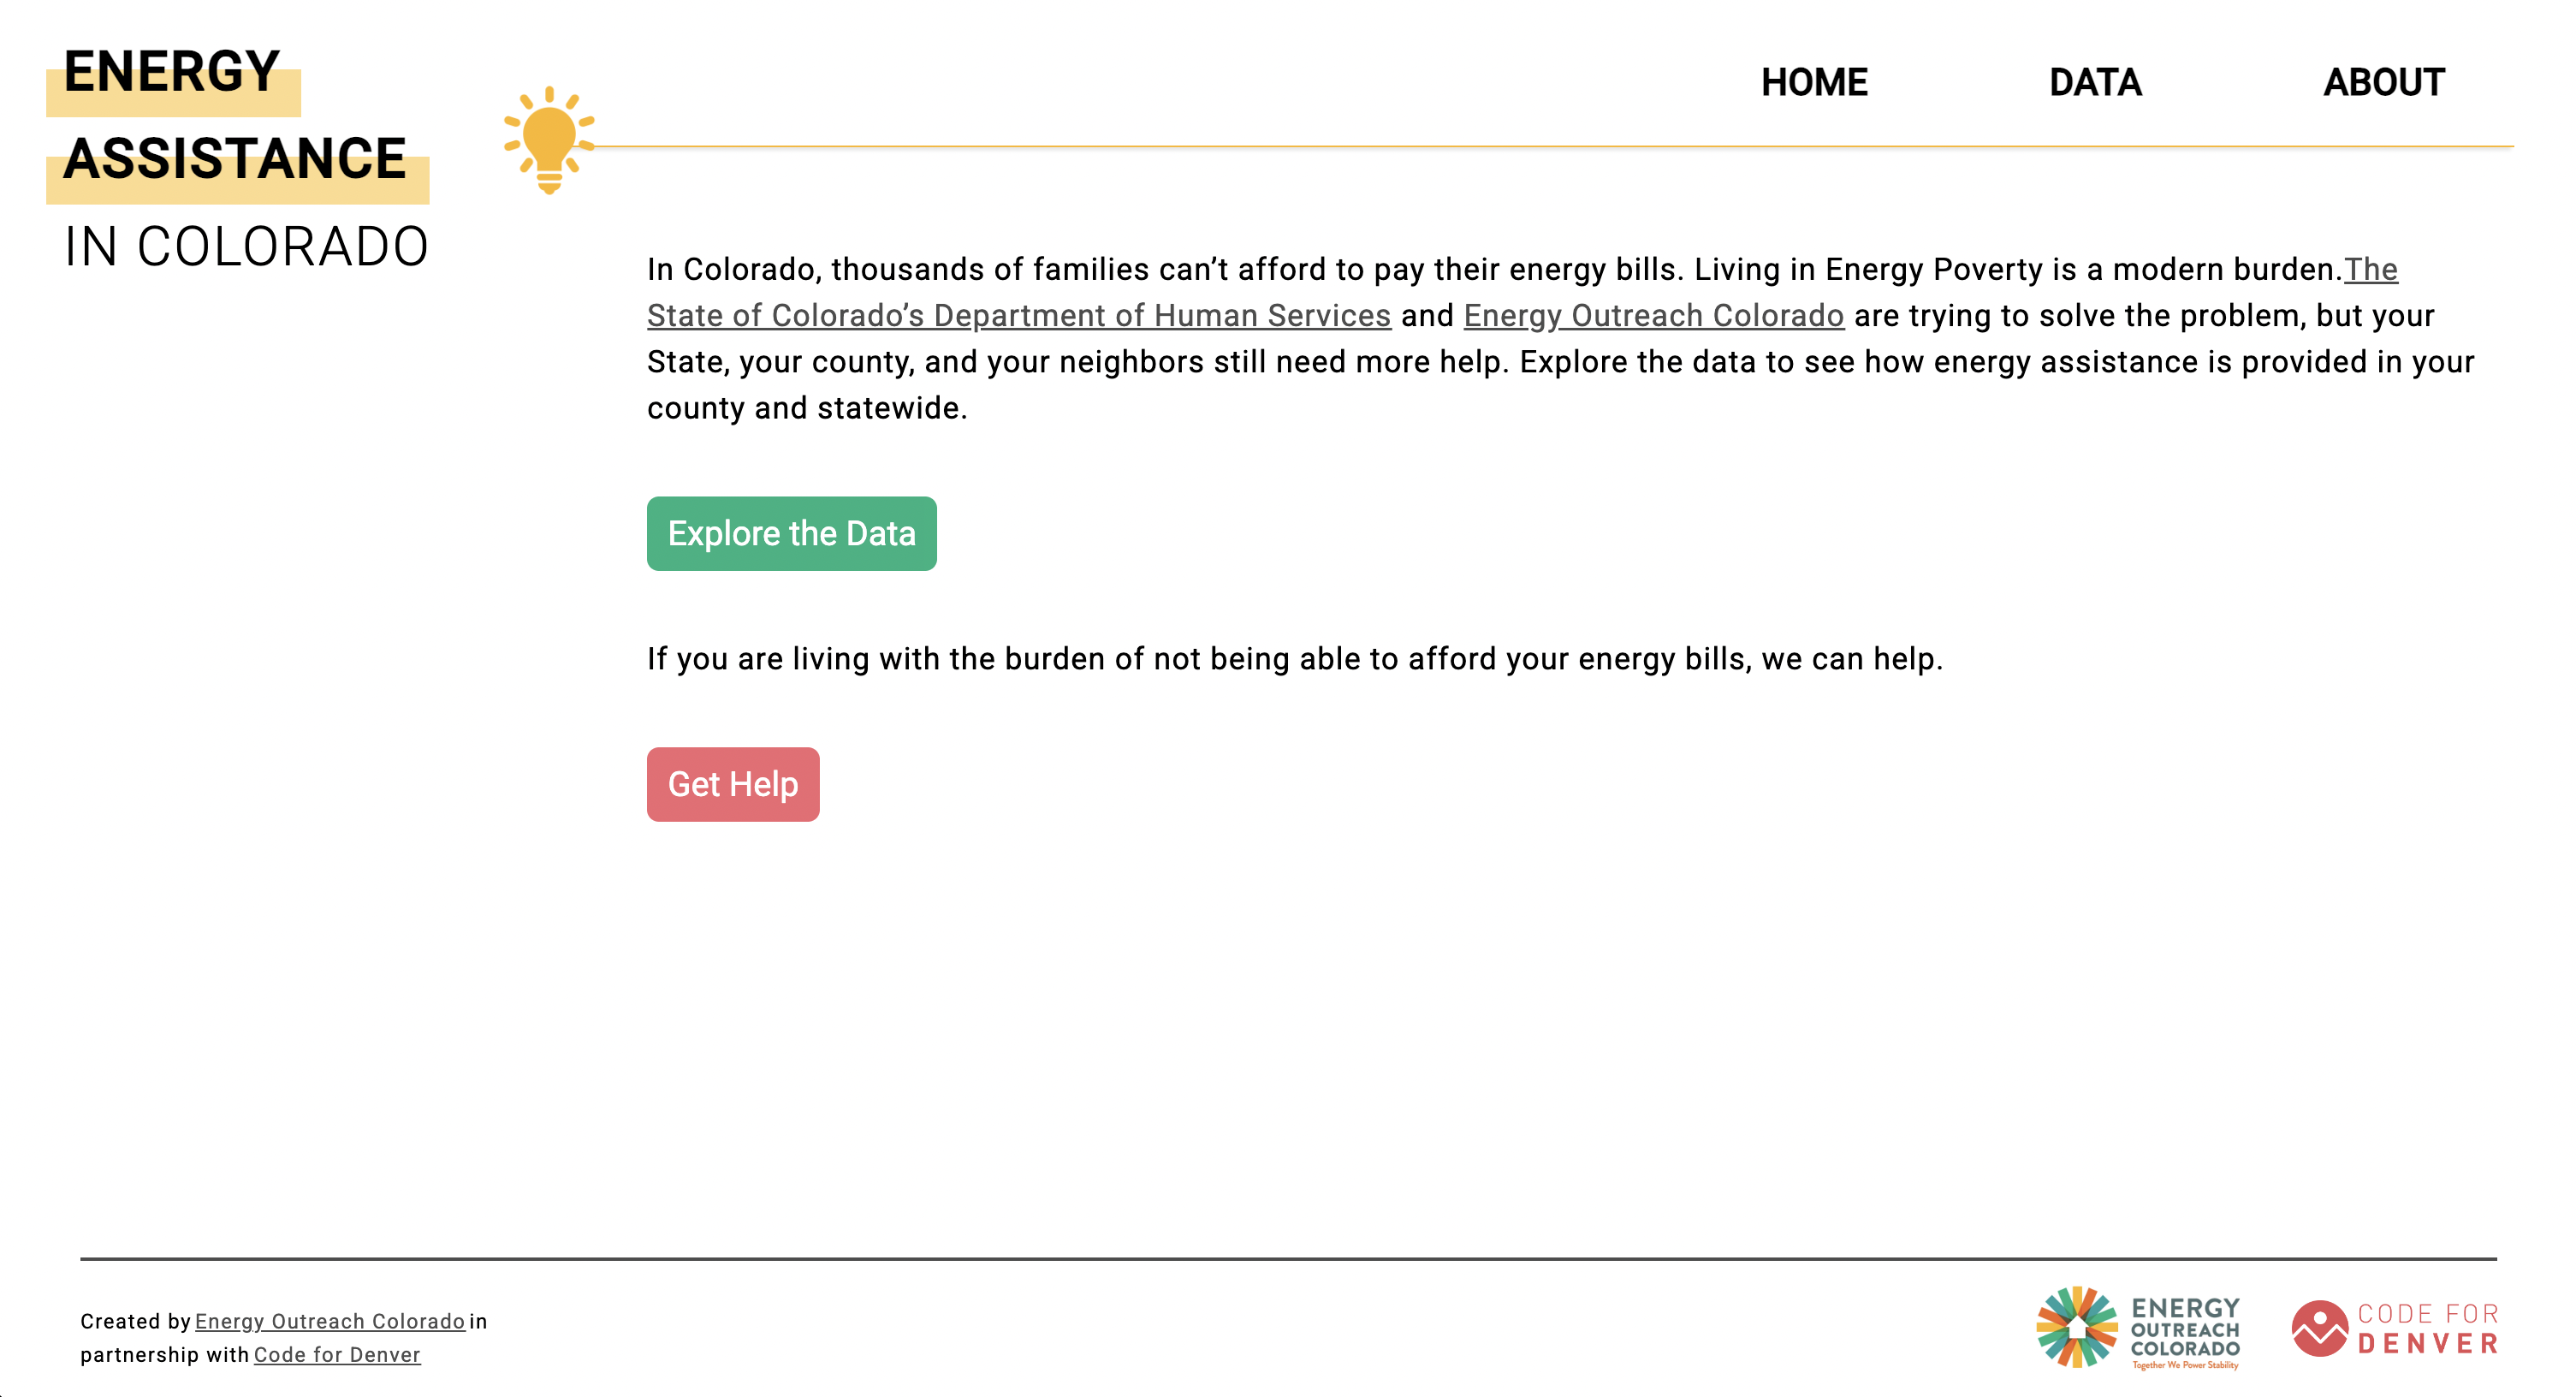
Overview
In Colorado, thousands of families can’t afford to pay their energy bills. Energy Outreach Colorado provides low-income energy assistance and wanted a way for people to see how that help is distributed, both in their own county and across the state. The goal was a single-page web application for visualizing and tracking that data. The project was completed by a small team of developers and designers within Code for Denver, a volunteer civic tech organization dedicated to building software for local governments and nonprofits.
The challenge
The data covered every county in Colorado across a decade, from 2010 to 2019. It needed to be easy to explore for anyone, from community members looking for help to people tracking trends in need, and available on a phone as well as a computer.
Working with a team
I served as one of the primary front-end developers on a volunteer team that included other developers and a UX designer. The designer created the designs in Figma, and I implemented them in code, working alongside the rest of the team to build out the application.
What I built
I was responsible for building a large portion of the Next.js application. For the data, I used react-vis, a data visualization library built on top of React, to create dynamically updated visualizations that showcase trends in energy assistance needs for each county between 2010 and 2019. I also implemented a responsive design so that all of the data could be accessed comfortably on mobile devices, not just on desktop.