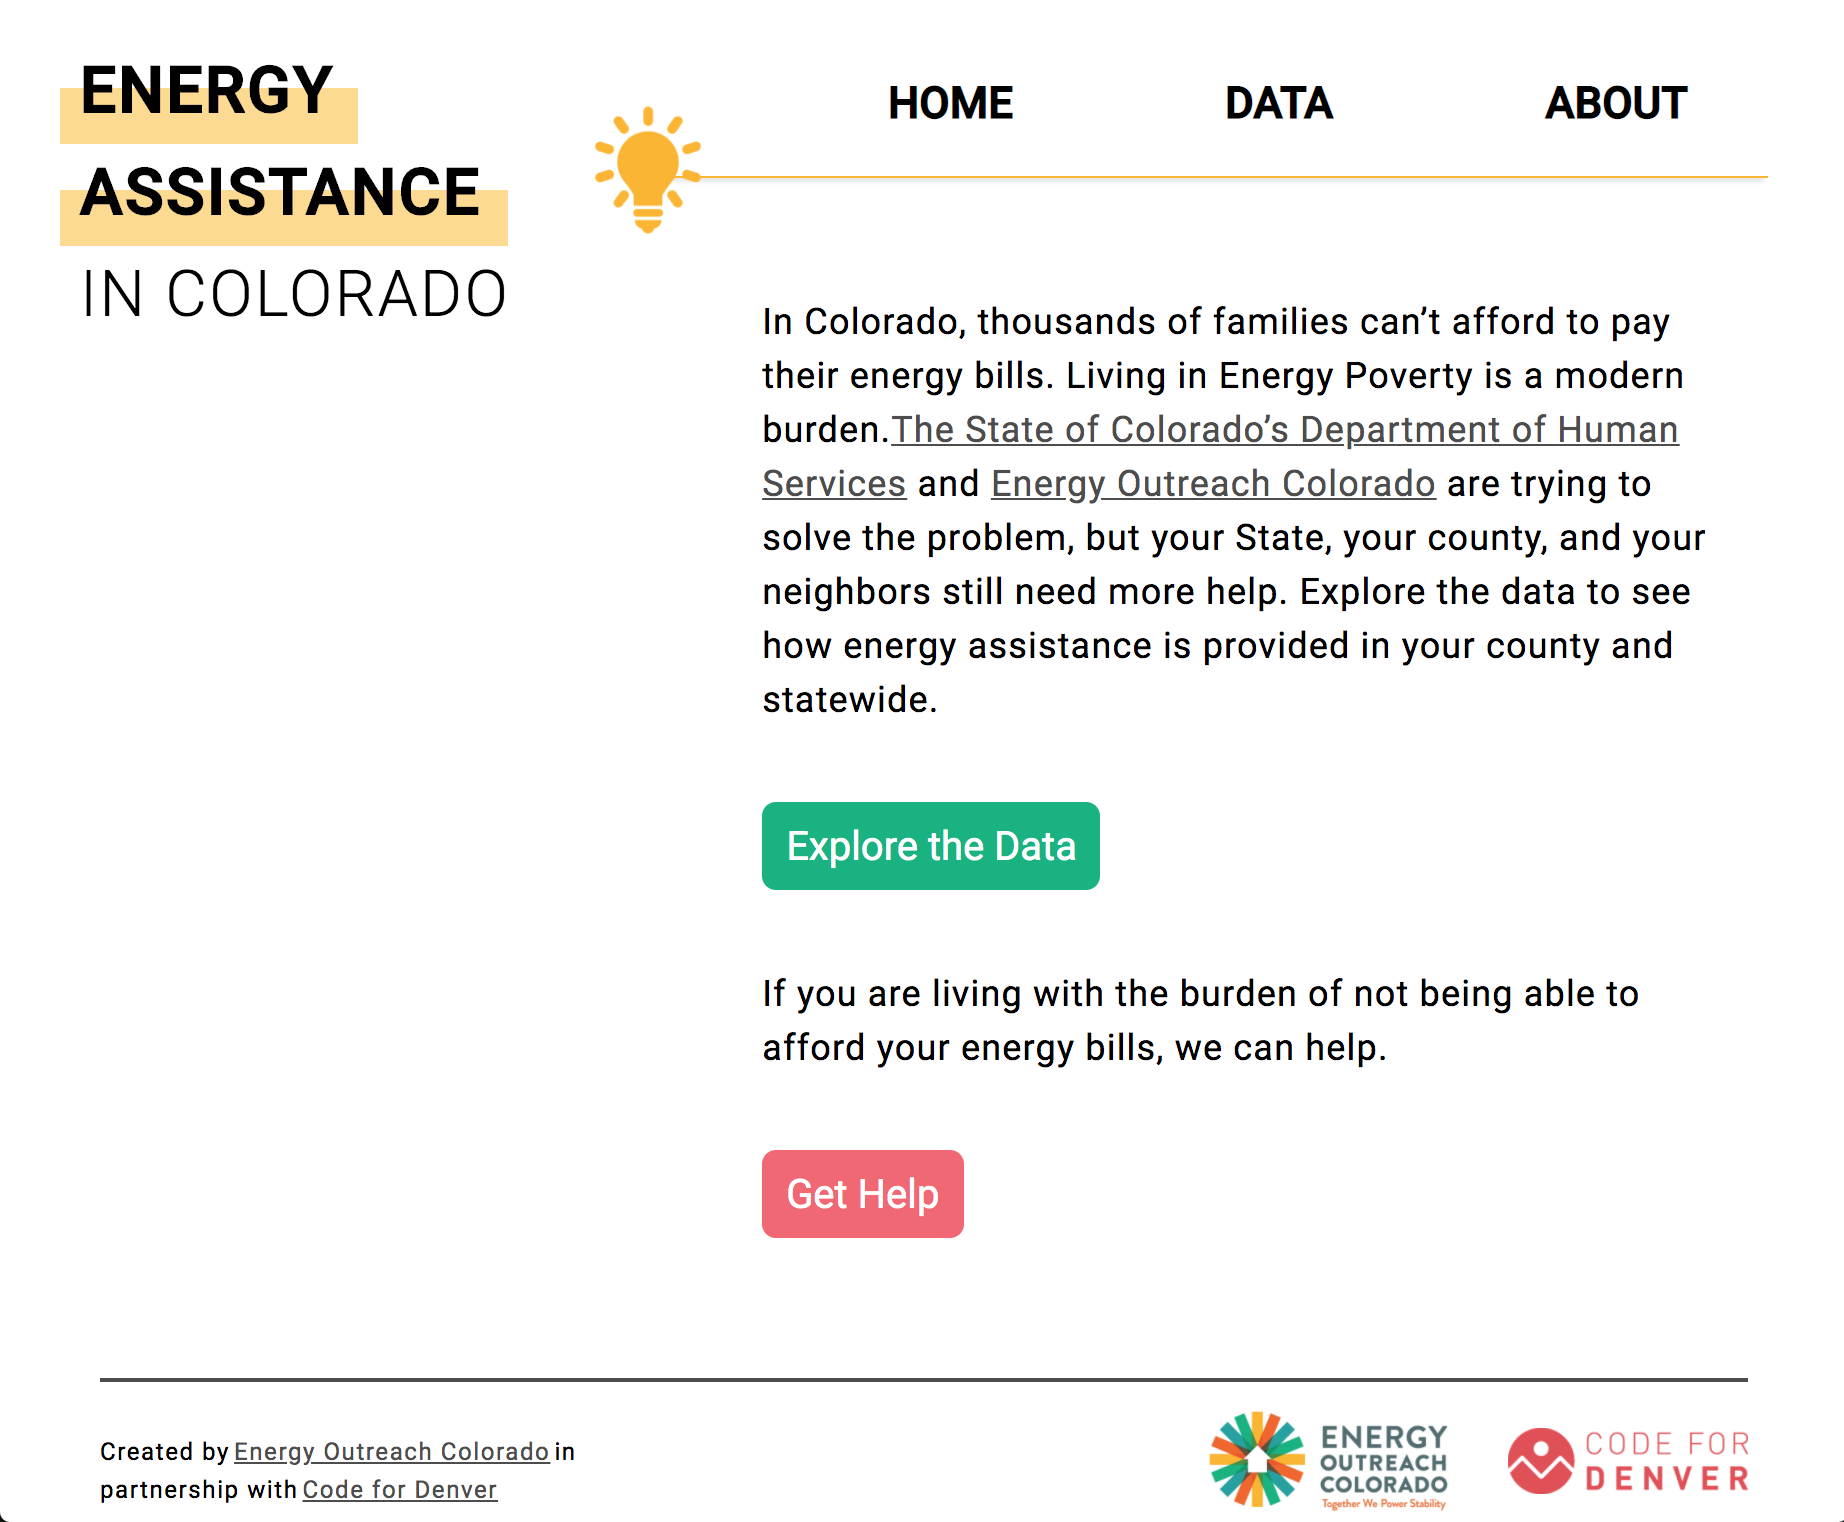
Purpose:
This project was completed by a small team of developers and designers within Code for Denver, a volunteer civic tech organization dedicated to building software for local governments and nonprofits. The goal of this project was to create a single-page web application for visualizing and tracking data related to low-income energy assistance provided by Energy Assistance Colorado.
Process:
I served as one of the primary front-end developers for this project and was responsible for building out a large portion of the Next.js application as well as implementing the designs provided by the UX designer. I used react-vis, a data visualization library built on top of React to create dynamically updated visualizations that showcase trends in energy assistance needs for each county in Colorado between 2010 - 2019. I was also responsible for implementing a responsive design that allowed all of the data to be accessed through mobile devices.
Technologies Used:
- Figma
- CSS
- JavaScript
- Next.js
- react-vis
*This website is still active however no current data is loaded into the system so data visualizations are not viewable.
www.katiewrennhansen.com