Purpose:
The aim for this project was to create an application that will track monthly spending data and display insightful data visualizations based on all transactions made in a single month. The goal was not to store any user transaction data, but instead to allow a user to upload a CSV, which will automatically generate insights surrounding their spending habits.
Process:
I built this application using React with TypeScript to handle all of the logic. I chose TypeScript to improve my own understanding of the language but also because this application handled a sizable amount of data, which I wanted to contain to a consistent format and having a typed language was useful. All of the data visualizations were built using D3.js as the library integrated well with TypeScript. The finished application is deployed on GitHub pages.
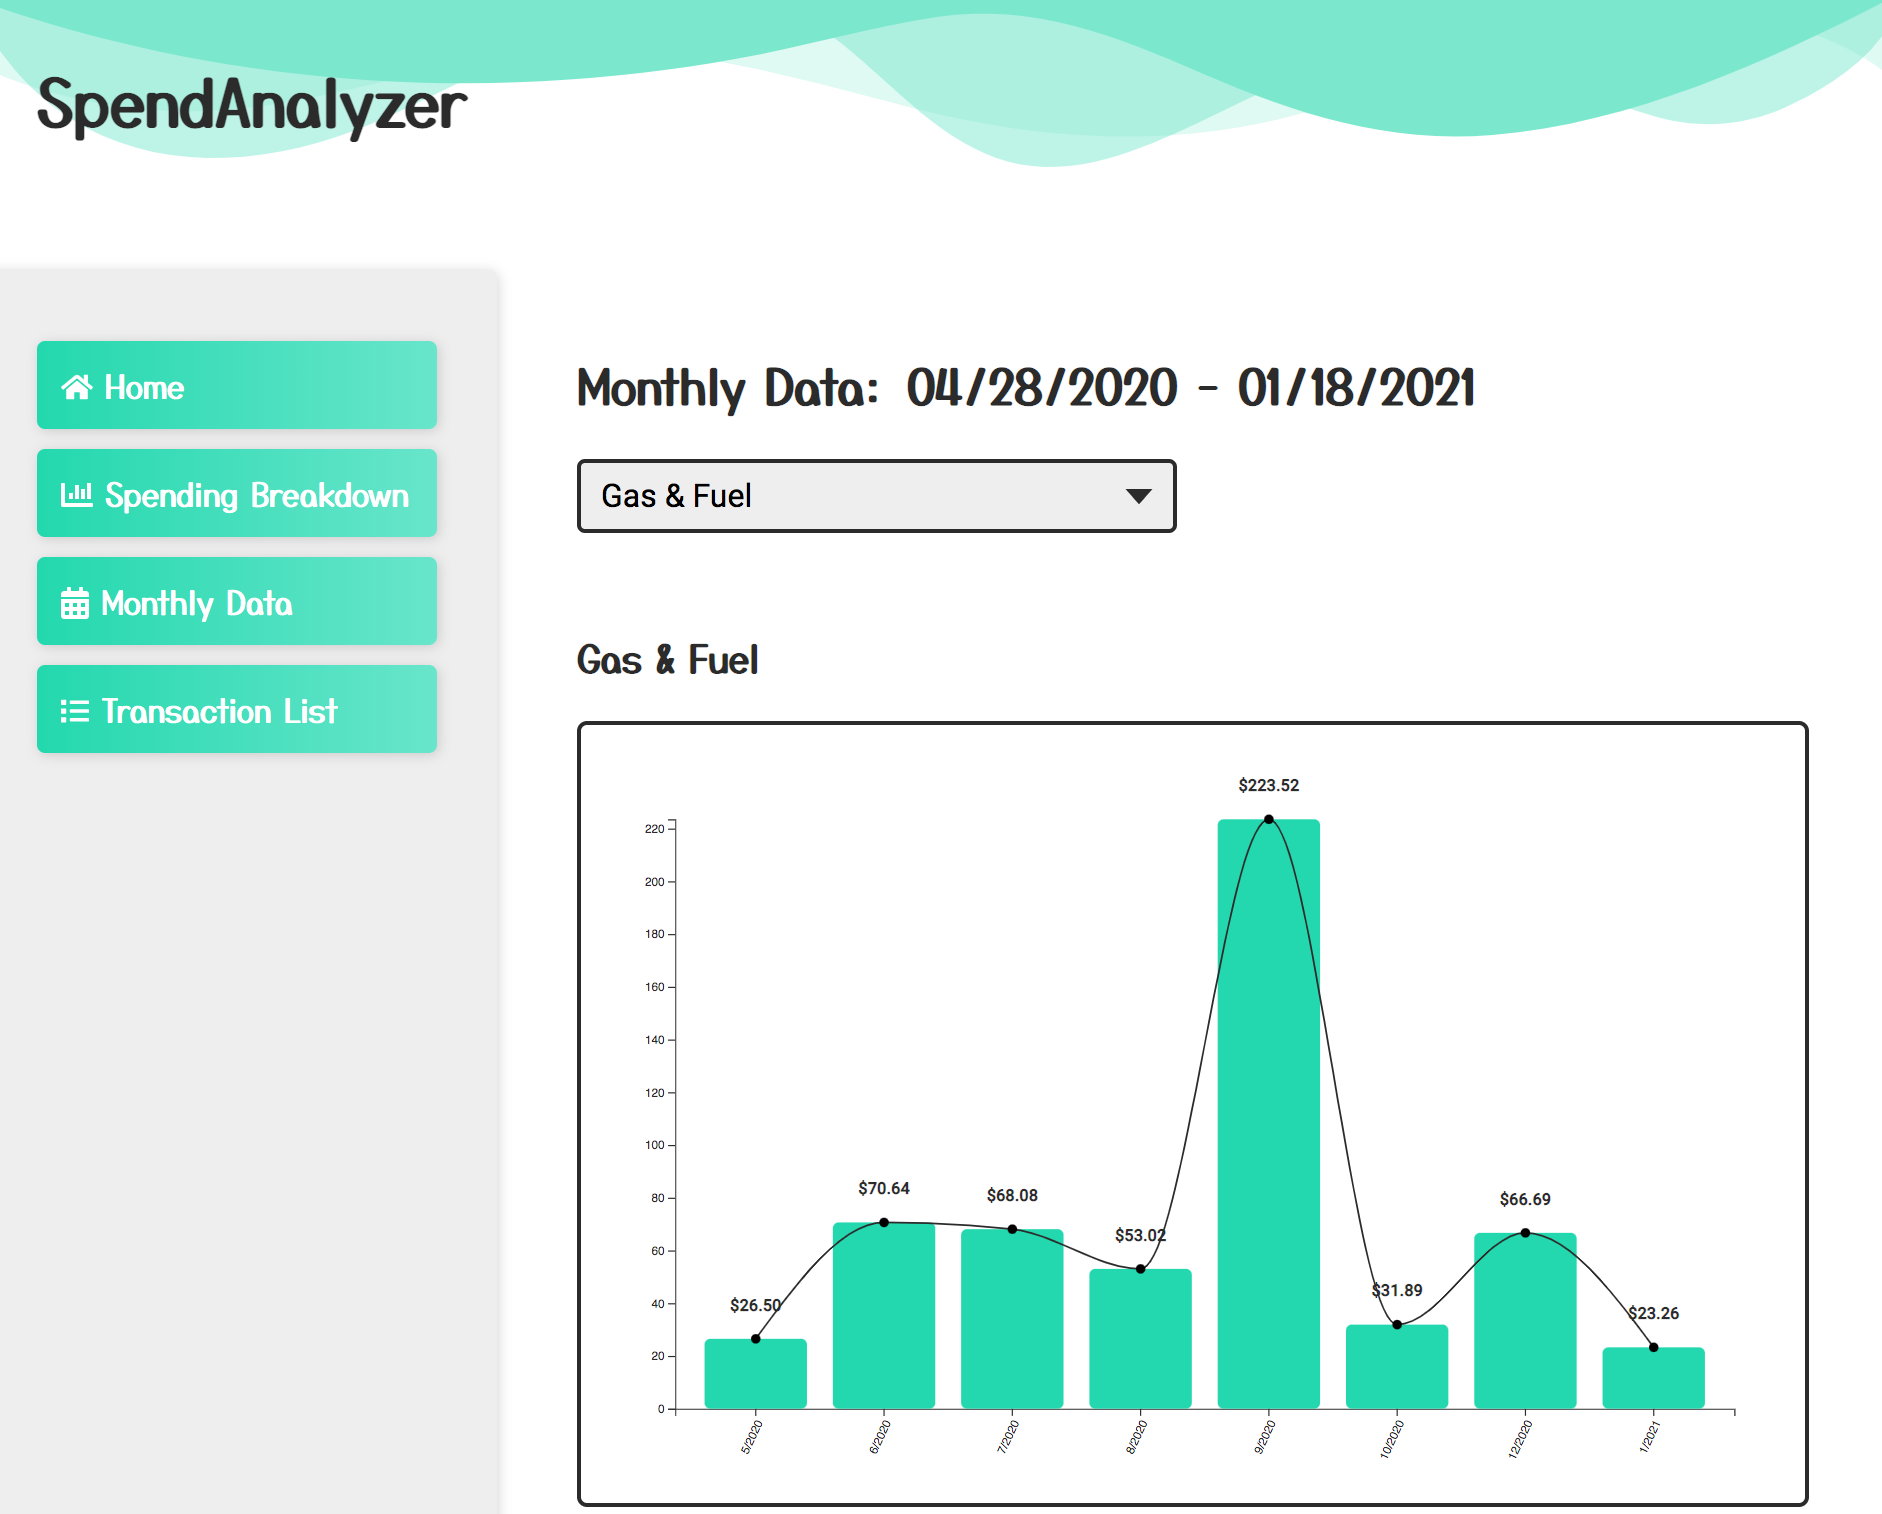
In order to use this application, users need to upload a CSV file with a specified format to ensure all calculations are possible. There are 4 main components to the application: a home component, which allows users to view an overview of their spending and exclude certain categories from their trends, a breakdown component, which allows users to view a breakdown of overall spending habits, a monthly breakdown component, which separates out spending by category per month and a transactions component, which lists all transactions made in the time frame. The combination of this information provides a deeper understanding into spending trends over time.
Technologies Used:
- CSS
- React
- TypeScript
- D3.js
www.katiewrennhansen.com